PowerFLOW
Computational Fluid Dynamics Simulation Software
Improving Product Design & Development
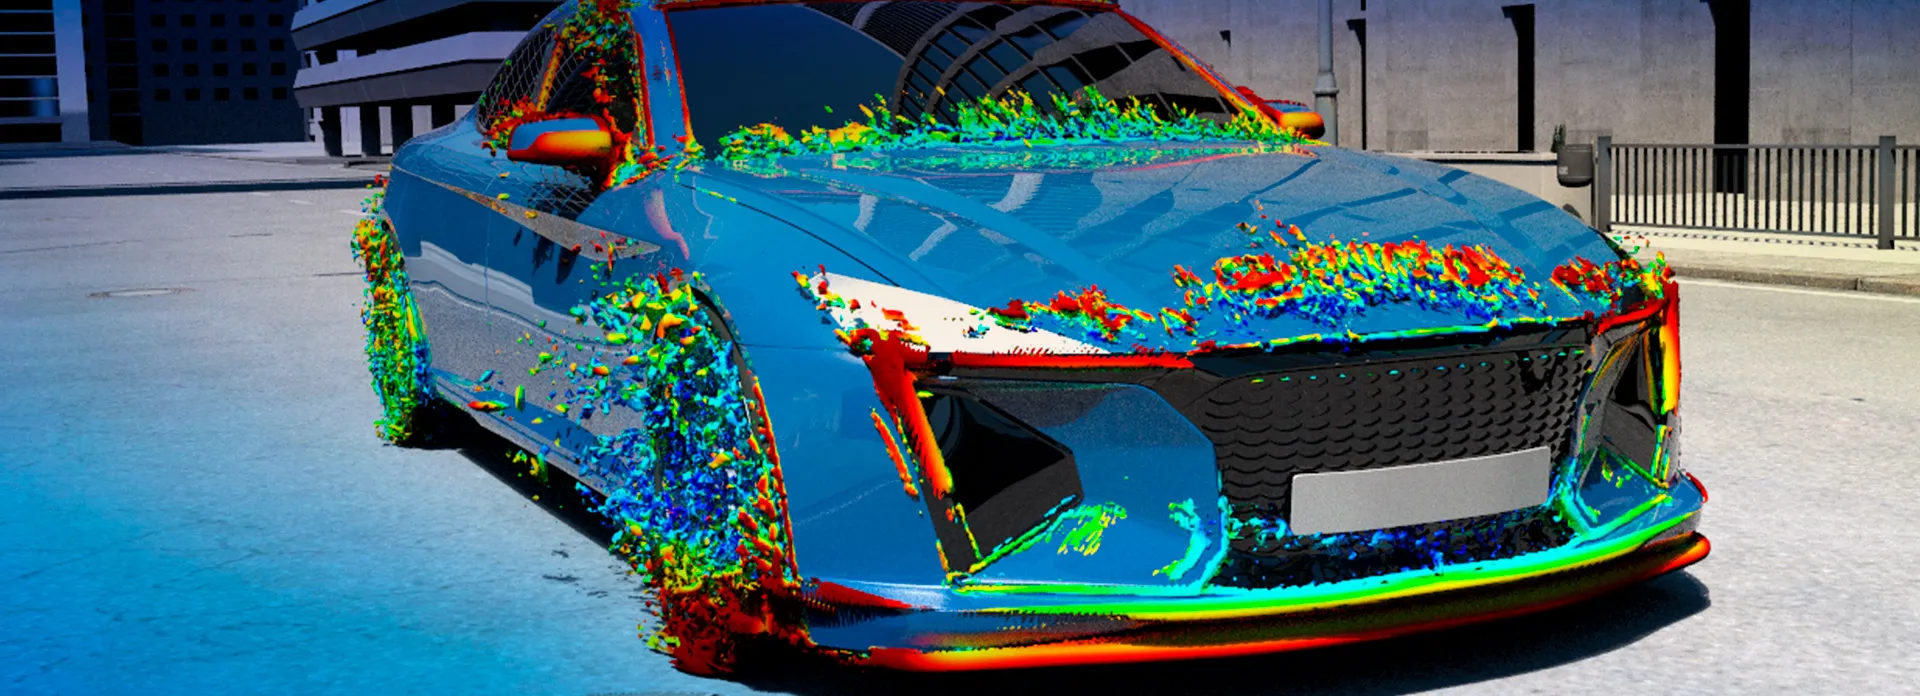
By leveraging our unique, inherently transient Lattice Boltzmann-based physics PowerFLOW CFD software performs fluid flow simulations that accurately predict real world conditions. Using the PowerFLOW suite, engineers evaluate product performance early in the design process prior to any prototype being built — when the impact of change is most significant for design and budgets. PowerFLOW imports fully complex model geometry and accurately and efficiently performs aerodynamic, aeroacoustic and thermal management simulations.
- Features & Benefits
- Key Capabilities
Features & Benefits
- High-fidelity CFD models. High fidelity transient Lattice Boltzmann based solver, providing accurate results across most fluid flow regimes (laminar to transonic) to solve the most complex CFD design problems in Transportation & Mobility and Aerospace & Defense.
- No volume & boundary layer meshing. Automated domain discretization and turbulence modeling with wall treatment eliminates the need for manual volume meshing and boundary layer meshing.
- Highly parallelized & scalable solution. Confidently run PowerFLOW simulations using many compute cores on common High-Performance Computing (HPC) platforms.
- Sophisticated physical modeling. Utilize moving geometries and Local Reference Frames (LRF), particle modeling, heat exchanger modeling, porous media with fluid flow, thermal and acoustic effects; Realistic Wind for on-road turbulent wind conditions to simulate real world effects.
- Coupled thermal solution. Simulate conjugate heat transfer problems with surface and volume conduction, thermal radiation and human thermal using built-in variable interval coupling with PowerTHERM.
- Coupled heat exchanger solution. Simulate effect of multiple heat exchangers for under hood thermal using coupled PowerCOOL.
- Automated pre- and post-processing. Use standardized Application Templates to automate pre- and post-processing for common applications and customize for specific engineering environments.
Key Capabilities
- Fast automated setup. Create and import geometry from CAD models, define initial & boundary conditions and choose measurements to record during simulation with this application. The intuitive, fast interface application provides an entirely automated fluid grid generation solution.
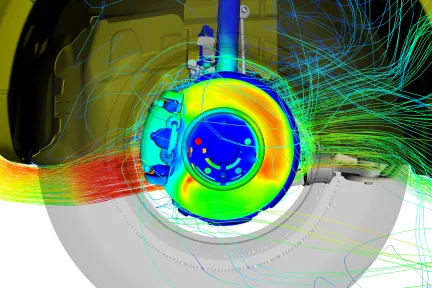
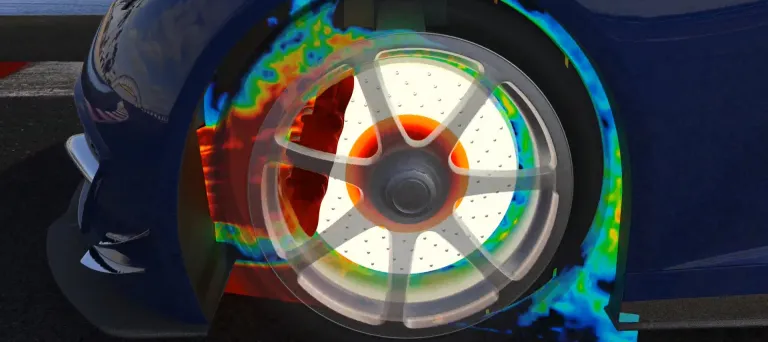
- True rotating geometry. PowerFLOW can simulate true routing geometry to optimize performance and noise in systems, such as wheel aerodynamics, brakes, HVAC systems, cooling fans and more.
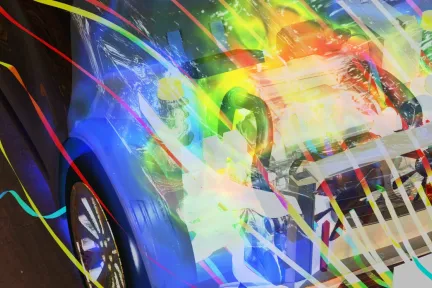
- Coupled simulations- fluid flow, thermal, acoustic. The PowerFLOW CFD software suite has the ability to seamlessly integrate PowerTHERM surface temperature & heat fluxes solvers and PowerACOUSTICS aeroacoustic noise tools to existing simulated designs.
- Digital wind tunnel. The digital wind tunnel model includes static and moving ground plane modeling and boundary layer suction point to match that of real-life experimental wind tunnels.
- Design Analysis. Upon simulation completion, PowerVIZ analyses results quickly and PowerINSIGHT automates results analysis.
- Rapid turn around time. Once a surface mesh model is prepared, the same model may be used to perform additional simulations. Setup, grid generation, simulation and results analysis can be performed in less than a day.
- GPU acceleration. Speed up your CFD simulations further with high-performance computing (HPC) on GPU.
Discover the Products
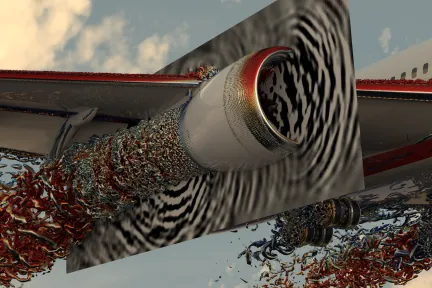
Noise Analysis
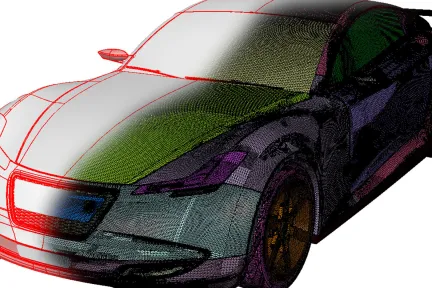
Geometry Preparation for Design Simulation
Streamline and Automate the Simulation Analysis & Reporting Process
PowerTHERM and PowerCOOL - A Complete Thermal Management Solution

Visualization for Results Analysis for Powerflow Simulations
Start Your Journey
The world of Design & Simulation is changing. Discover how to stay a step ahead with SIMULIA.
FAQs About CFD
Also Discover

Engineering Software from SIMULIA
Steady-State and transient Internal and external flow around and through solids and structures
Learn What SIMULIA Can Do for You
Speak with a SIMULIA expert to learn how our solutions enable seamless collaboration and sustainable innovation at organizations of every size.
Get Started
Courses and classes are available for students, academia, professionals and companies. Find the right SIMULIA training for you.
Get Help
Find information on software & hardware certification, software downloads, user documentation, support contact and services offering