How Gantt Charts Help Teams Stay on Track
A Gantt chart is a valuable project management tool that can help you to stay on top of multiple tasks and keep your team on track. We take a look at why Gantt charts have become so popular and how you can use them to optimize task scheduling.
What is a Gantt chart?
Sometimes called ‘roadmap tools’, Gantt charts are incredibly useful project planning tools. Management teams use Gantt charts to record information about scheduled tasks and monitor how they are progressing in relation to the time that has been allotted for them.
A Gantt chart displays tasks and timelines as a horizontal bar chart with start dates and end dates. It also contains information on who is responsible for the task, deadlines, scheduling information, task dependencies, and how far a given task is to completion. Gantt charts allow project managers to monitor task duration, milestone tracking, and project progress.
Typically, a Gantt chart is split into two sections, the left section details the required tasks while the right side acts as a timeline visualization with schedule bars. Each bar represents a certain task. At the top of the left section is a time scale. With a Gantt chart, a project manager can see at a glance all the activities related to a particularly large and complex project, which team members have been assigned to the activities, and if any activity is behind or ahead of schedule.
Discover effective project management solutions from Dassault Systèmes
Reduce waste, effectively manage your team, and streamline your product development processes with the powerful management tools from Dassault Systèmes. Visit the Dassault Systèmes store to discover how roles such as Project Planner, Lean Team Player, and 3DSwymer can enhance the way you work.

ENOVIA Project Planner
Reduce resource and overall project execution costs by enabling lean optimized team planning

ENOVIA 3DSwymer
Connect employees, partners, suppliers, customers, consumers and regulators into a framework for sustainable innovation.

DELMIA Lean Team Player
Make collaboration effective, intuitive and easy with a cloud-based whiteboard designed to fuel innovation
The history of Gantt charts
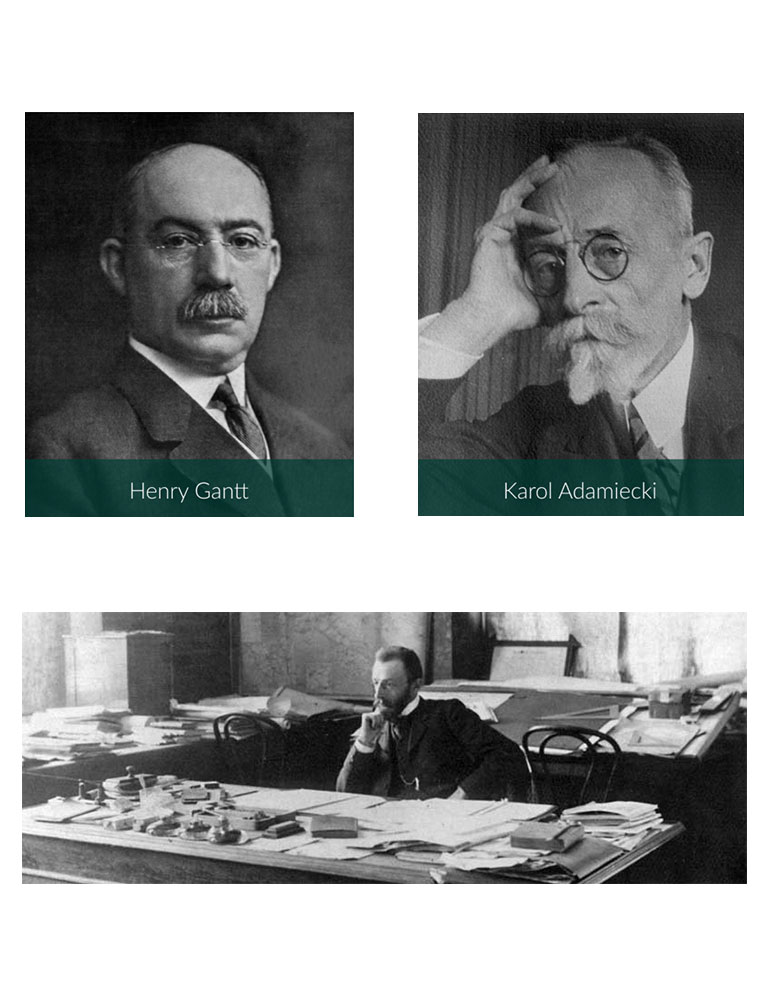
While Gantt charts are named after American engineer Henry Gantt, the concept was first invented in the 1890s by a Polish engineer named Karol Adamiecki. Adamiecki managed a steelworks factory and was trying to develop a method where he could more efficiently manage teams, resources, and time. This led him to the creation of what Adamiecki called ‘harmonograms’. While harmonograms were one of the first instances of a chart that displayed deliverables and timelines, Adamiecki did not make his charts public until many years later, and then only in Polish.
Some 15 years later, Henry Gantt took Adamiecki’s concept and refined it into the format that we now refer to as Gantt charts. Gantt charts were used extensively by generals during the First World War and became popular in the business world after the war ended.
Originally, Gantt charts were hand-drawn as tables and took considerable time and effort to create. Once drawn, any project scheduling changes meant that the entire chart would have to be redrawn. Now, dedicated software allows project managers to create Gantt charts quickly and update them whenever necessary.
How Gantt chart software works
Gantt chart software enables project managers to visually represent project timelines. They can be used to optimize resource management, accurately track project milestones, and critical path analysis.
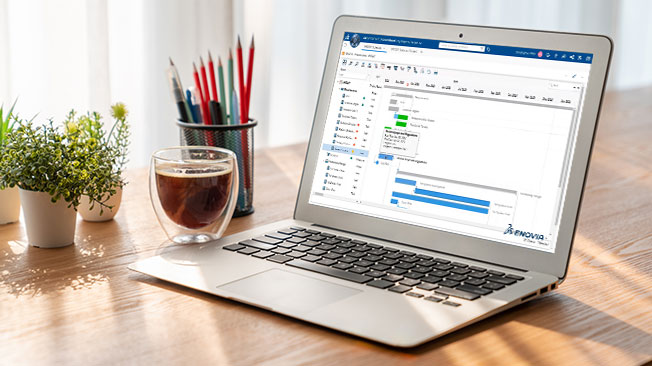
Most Gantt chart software works just like a highly sophisticated spreadsheet. Users input data regarding tasks and timelines into a template. Tasks are entered into a vertical axis on the left of the chart and the timelines are entered horizontally on the right of the chart. Unlike a spreadsheet, however, Gantt chart software provides more details than just the duration of a task and its end date.
The best Gantt chart software includes various features and functions that make project tracking easier. These features can include visual indicators that show task dependencies and deadlines, critical path functions that can be used to determine the quickest way to complete a project, and features that stack budgets against timelines to allow for optimized resource leveling. Tasks can be allocated, and timelines can be changed instantly via drag and drop features.

The benefits of Gantt chart software
Gantt chart software provides project managers with insights into how resources and time can be allocated in the most optimal fashion. By manipulating the data in the chart, a project manager can determine the best use of teams and time. In this way, Gantt charts can greatly increase productivity. They also allow for easier team collaboration and coordination as a Gantt chart gives stakeholders a clear visualization of the status of a project. Critical decisions can be made based on the information contained in a Gantt chart.
The drawbacks of Gantt chart software
However, there are some drawbacks to using Gantt charts. Judging project scope accurately can be difficult if a chart is overly complex. Large projects require highly detailed Gantt charts that can require considerable effort to maintain. If a Gantt chart is not updated, then it will provide erroneous information which can lead to incorrect project tracking, missed deadlines, and budget overruns. While Gantt chart software is highly useful, like most software tools it is only as good as the data that has been put into it.

Browse all the Dassault Systèmes store applications
We feature in our store some of our best software to design, collaborate and innovate throughout the entire product lifecycle.
Content related to Gantt Chart software
Common applications of Gantt chart software

Project managers across a wide range of industry sectors use Gantt charts for project scheduling and project tracking purposes. Gantt charts are ideal for organizing a large project effectively by breaking it down into a series of smaller, more manageable tasks. This allows for logistics to be more easily monitored as well as task dependencies and metrics such as milestones and deadlines.
Gantt charts are used for any project where a multitude of small tasks must be completed on time to avoid delays or budgetary overruns. You’ll find Gantt charts being used for construction project management purposes, for software development and IT project management, and for manufacturing and production scheduling. Other common uses of Gantt charts include event planning and management, research project management, and product lifecycle management.
What are the alternatives to Gantt charts for project management?
As useful as Gantt charts are, they can be unnecessarily complicated and inflexible. Because of the amount of work involved in updating a Gantt chart, many project management specialists prefer to use other alternatives.
- Kanban boards
- Project network diagrams
Kanban boards
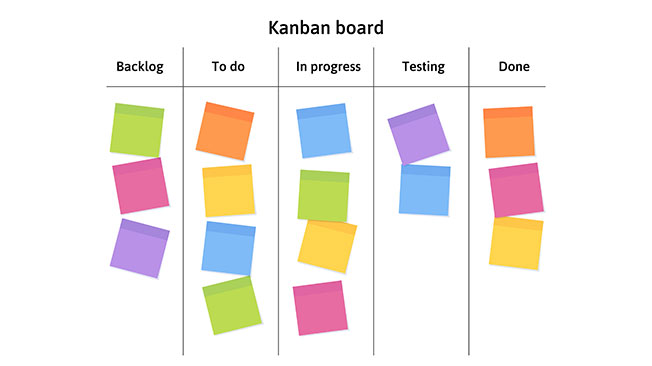
Kanban boards are arranged as a series of columns. Each column contains cards that have detailed information on each task required for the project. A card will show what the task is, who is assigned to it, and when it must be completed by. Typically, a Kanban board will have a column for requested tasks, a column for tasks that are in progress, and a column for completed tasks. Kanban boards are used in lean management techniques and are preferred by many managers for their simplicity.
Project network diagrams
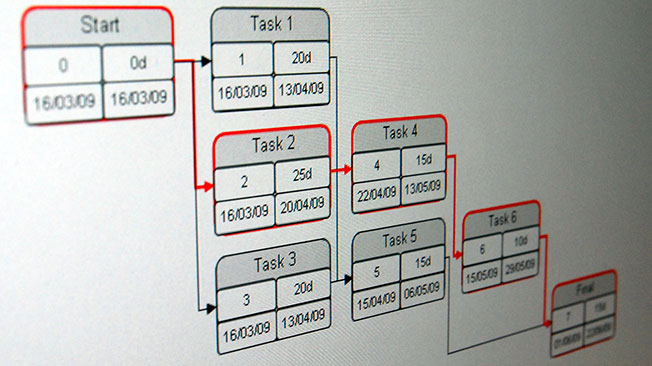
Another alternative is a project network diagram. Known as PERT charts, project network diagrams are a Program Evaluation and Review Technique tool. A project network diagram sets out tasks in boxes or circles connected with arrows or lines. Unlike a Gantt chart, a PERT chart is drawn in a free-form manner and is often used because it more accurately depicts task dependencies.
Conclusion - The benefits of Gantt charts for project management
Managing a large project is a time-consuming and highly complex undertaking. Project managers need to make sure that tasks are being completed on schedule and that there are sufficient resources and manpower allocated to each task. The main benefit of a Gantt chart is that it collates all the vital information about a project into one clear and easy to read document. A Gantt chart is an invaluable project management tool when coupled with the right software.
A Gantt chart gives a project manager a bird’s eye view of how a project is developing. Gantt charts are usually used for waterfall management techniques, where tasks must be completed before others can begin. But they can also be used for agile management methodologies where tasks are conducted simultaneously by different teams.
Explore Dassault Systèmes solutions
Discover the powerful browser-based modeling solutions from Dassault Systèmes. You can design whatever you wish, wherever you are with 3DEXPERIENCE.
Connecting data & people to foster innovation
The 3DEXPERIENCE platform on the cloud gives you access to a various set of applications that allow you to design, simulate, inform and collaborate on a project.
Why choose Dassault Systèmes for your project management needs?
The power of the 3DEXPERIENCE platform
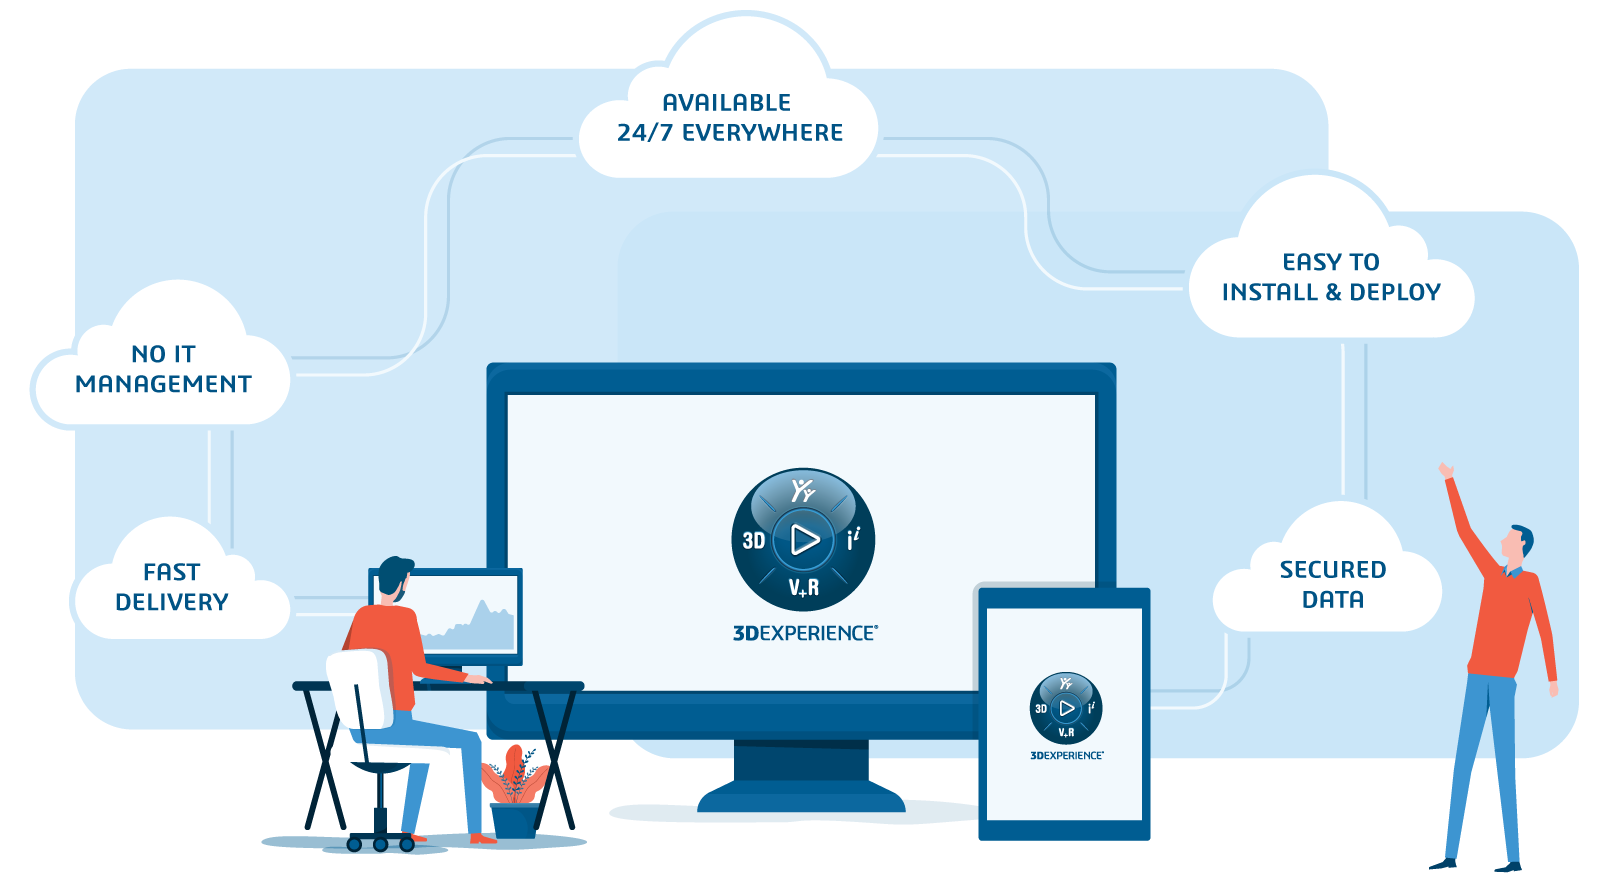
To ensure success, any major project requires constant collaboration between stakeholders. Using the 3DEXPERIENCE platform, you can ensure that your team is up to date with all developments. Using cloud based computing technology the 3DEXPERIENCE allows teams to share and work on files via one platform. You can work from anywhere in the globe at any time using any type of device you choose.
The 3DEXPERIENCE gives you access to a range of powerful software tools from Dassault Systèmes. Create social communities where teams can collaborate using the 3DSwymer role. Enhance productivity with the Lean Team Player management tool. More effectively manage tasks with Project Planner. All of these innovative roles are fully integrated with the 3DEXPERIENCE platform.

Explore innovative project management software from Dassault Systèmes
The best project managers know that real success can only be achieved using the specialized tools developed by a company that knows what its clients need. For more than 40 years, Dassault Systèmes has been providing industries with advanced CAD solutions.
Our experience and knowledge have allowed us to develop a range of customized tools that give you more flexibility and power, and enhance your ability to manage and communicate with your teams. With Dassault Systèmes, you can discover better ways to create, plan, and innovate. Transform the way you work with the remarkable CAD tools from Dassault Systèmes.

